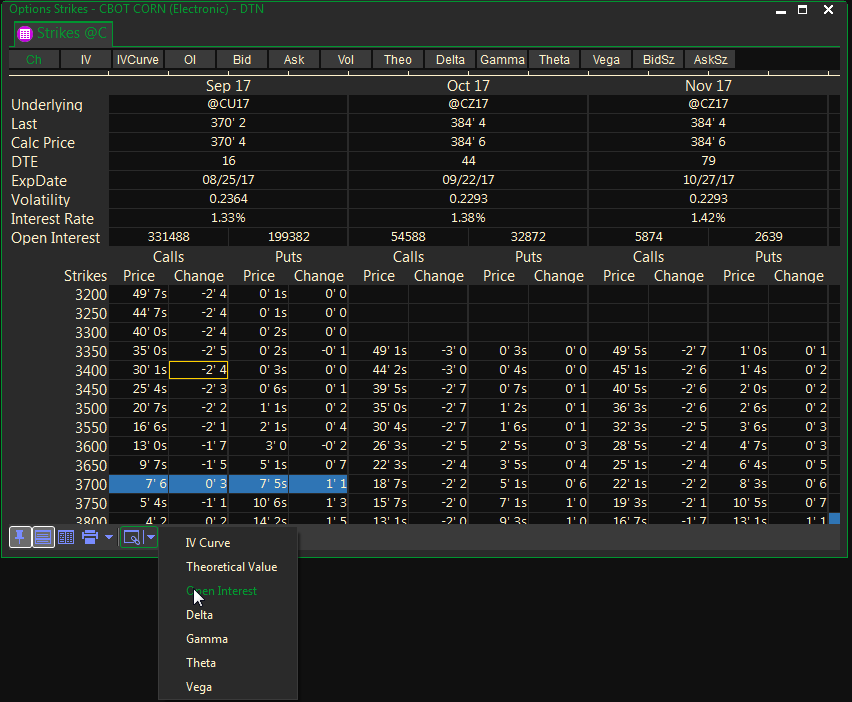
The Strike display shows all strike prices for all contract months that are trading under a specific symbol.
Here are some tips that will make your access to options more efficient.
- To go to the full options Series display from the Strike view, double-click on the contract month at the top of the Strike View screen. That Series month will open and a tab will be added to your existing window for this month. To go back to the Strike view just click on the Strikes tab.
- To chart Volatility, OI and VOL, or the Greeks, first, click in the option month you want to chart. Then, click on the chain link button at the bottom of the view and make your selection. If the button is not displaying, press the F2 key to toggle the button bar on or off.
- To chart the history for a specific strike , right click on the strike row in that month’s column and select New/Chart.
- To access other ProphetX displays right from the Strike View display, right-click on a price and select New and then your display selection.
To Open a Strike View Options Window
- Select Strike View from the OPTIONS menu on the Main Menu Bar
- Under Root Symbol, enter the Futures Root Symbol only
- Click the OK button
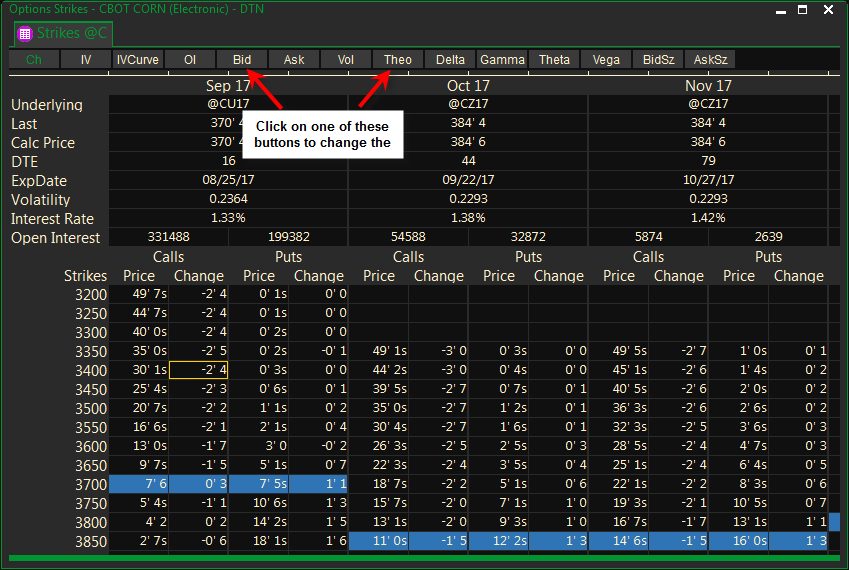
The display always opens with the Price and Change for each strike. Click on the buttons on the top of the display to select other information.
Binomial Tree View
This view is widely considered a more accurate pricing model. It calculates two possible values for an options, then the display creates a distribution of possible stock prices.
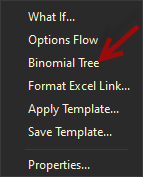
- Right mouse click anywhere in the display
- From the Right mouse click menu, click on Binomial Tree
- This will automatically open the Binomial Tree next to the regular Strike Display

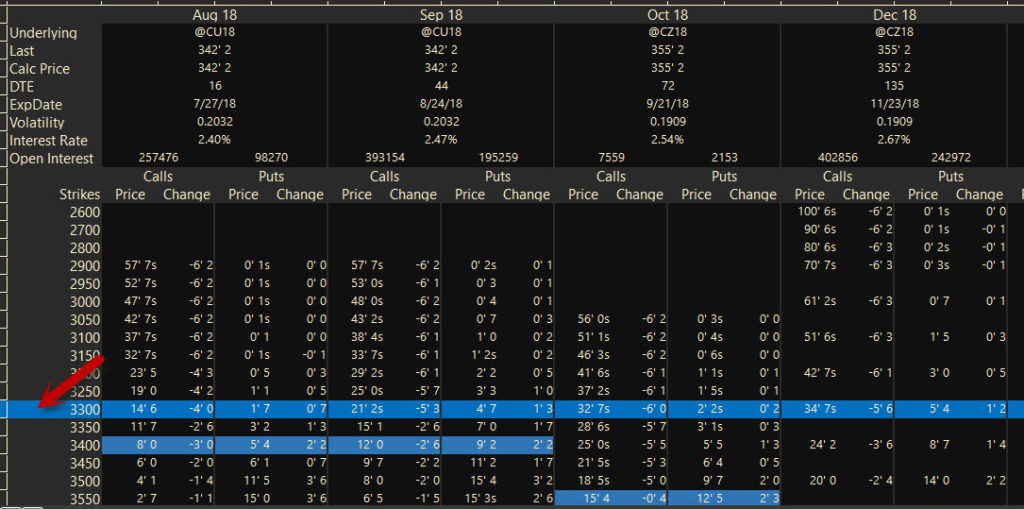
Highlighting an Entire Row in the Strike Display
By double clicking in the blank area to the left of the desired price, you can highlight the entire row.
Creating Custom Buttons
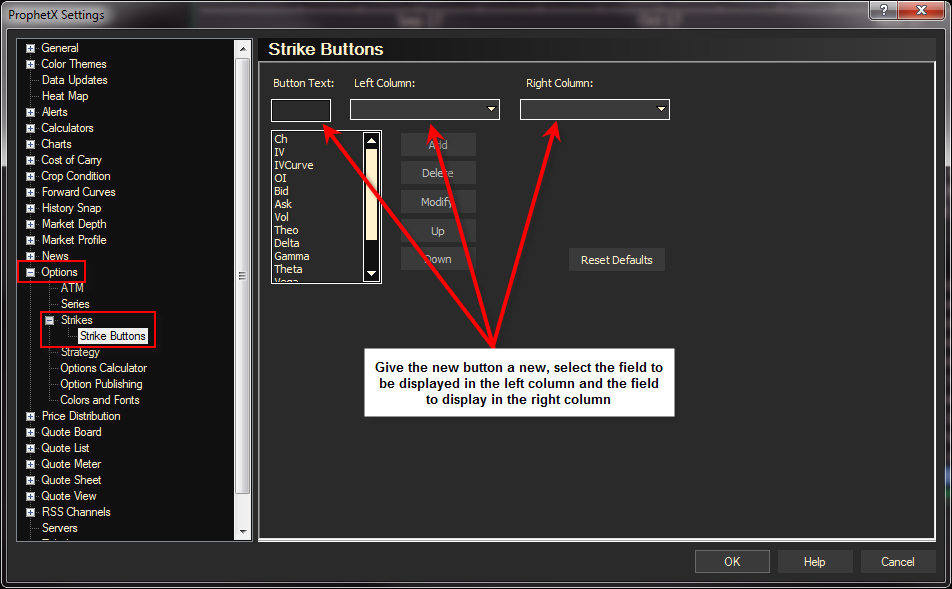
You can customize the Strike display by Adding your own buttons and field combination. You may have a maximum of 12 buttons. If you already have 12 and you want to add another, you must delete and existing one.
- Go to Preferences/Options/Strikes and select Strike Buttons.
- In the dialog box, name the button you are creating
- Select the field you want to display in the left column
- Select the field you want to display in the right column
- Click New and OK
Any new Strike display will show the button you created.
You may also Modify or Delete current buttons or move them around on the display by using the Up and Down selections.
To Rename Tabs
Right-click on the tab and select RENAME TAB from the pop-up menu. Type the new name in the text box that opens and click the OK button.
Click the Cancel button to cancel the change.
To Rearrange Tabs
Place your pointer on any Options tab and drag it to the desired location on the tab bar.
To Change the Color of Puts and Calls in the Option Graph
- Right-click on the Options Graph and select Graph Properties from the pop-up menu.
- In the Properties dialog, select the Colors tab.
- Select an element to change: Calls, Puts, or Back Ground.
- Click on a color for the selected element. If you wish, click Apply to view your changes while the dialog remains open.
- Repeat steps 3 and 4 to make other changes, then do either of the following.
- Click OK to apply the changes and close the dialog.
- Click Cancel to exit: Only changes made before clicking Apply will remain.
Options Charting
The Options Chart will display the IV Curve, Theo Value, Open Interest, Delta, Gamma, Theta and Vega values from an Option Strike window.
- Open a Strike View Options window
- Click on the option month to activate it for use in the chart
- Click on the drop-down arrow on the Context toolbar and select the data you would like to chart
