To Open a Series View Options Window
In the ATM View display, double-click on the options month you would like to view. A new tab will be created in the same window with the detailed options series for that month.
You can also open the Series display as a standalone window:
- Select Series View from the OPTIONS menu on the Main Menu Bar
- Under Futures Symbol, enter the futures symbol you want to view (Ex: @CZ11)
- Click the OK button
About the Series Options Window
The Series Options Window has two parts:
- The Underlying Futures section at the top of the window contains for the underlying instrument as well as other properties that apply to the individual strikes (e.g. expiration date, interest rate).
- The Options section (below the underlying section) contains the At The Money Calls and Puts for the Underlying Futures section.
There are two different ways to view the Puts and Calls – Above/Below and Side by Side
The options are sorted by strike price and center around the at-the-money strike. You may specify the number of strikes in and out of the money.
- Right click in the Underlying area of the display
- Select the Config tab
- Enter the number of in and out of the money strikes to display
NOTE: Your prices will be skewed if you enter too many or too few strikes. The options calculations are based on the number of strikes you select. For example, if there are too many and there is no trading taking place on future options ProphetX will still use the zero values in the options formulas.
The columns of the option section contain values or properties of each strike and values resulting from the calculations of the pricing model. To change the content of a column, refer to Arranging Option Window Columns.
Side by side Options Display
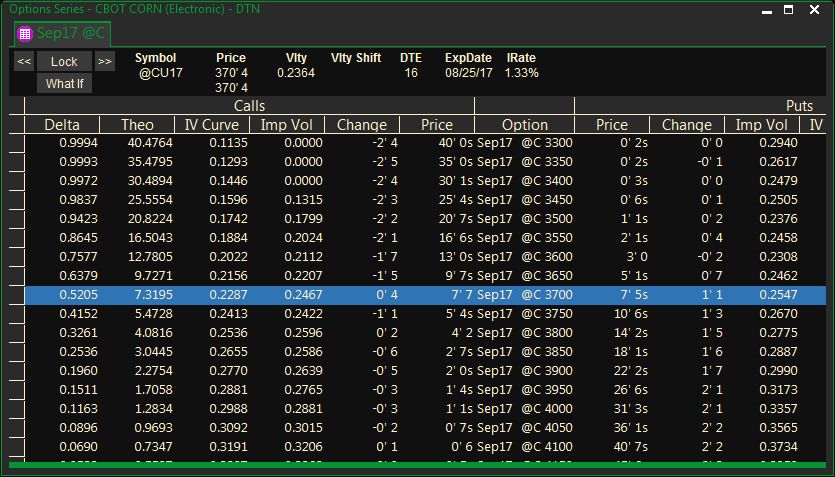
The example below shows the calls and puts side by side with the calls to the left of the OptDesc column and the Puts on the right side of the OptDesc.
- To display side by side right click in the Underlying area and select Properties.
- Select the Config tab
- Mark the Side by Side selection
- Click OK
Above/Below Options Display
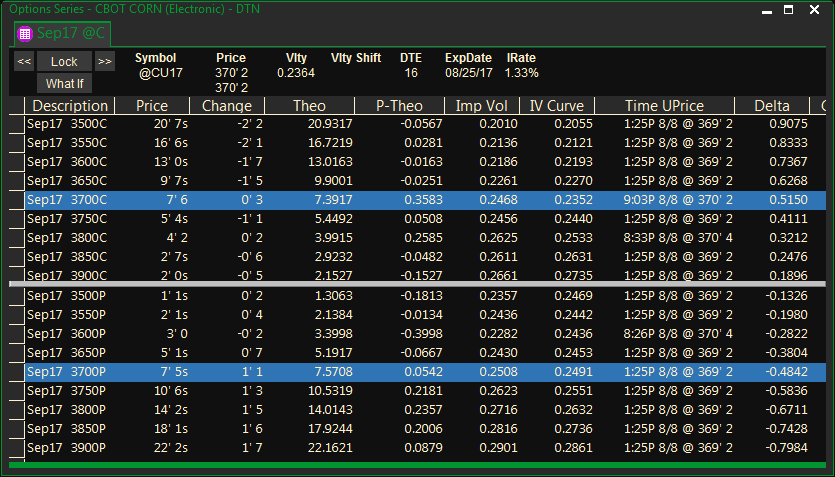
Above/Below Options will display all the strike prices on the left side with all the calls in the upper portion of the window and the puts in the lower portion as shown below.
- On calls, in the money is displayed above the At the Money line (displayed in blue)
Out of the money for calls is displayed under the At the Money line - For Puts, the In the Money strikes are displayed below the At the Money line
Out of the Money strikes are shown above the At the Money line
Above/Below is the system default. However, you can revert back to it from the side by side view:
- Right click in the Underlying area and select Properties.
- Select the Config tab
- Mark the Side by Side selection
- Click OK
To change values that affect the whole window, right-click on the underlying section and select commands described in Changing Option Values for the Options Window.
Adding an Options Tab to the Options Window
In the underlying section click on the left arrows for the previous month or click on the right arrows for the forward month options.
To Delete an Options Tab from an Options Window
Right-click the Options tab you want to delete and select Delete Tab from the pop-up menu.
To Rename Tabs
Right-click on the tab and select Rename Tab from the pop-up menu. Type the new name in the text box that opens and click the OK button.
Click the Cancel button to cancel the change.
To Rearrange Tabs
Place your pointer on any Options tab and drag it to the desired location on the tab bar.
The Context Tool Bar
The Context Tool Bar is located at the bottom of the window frame. The F2 key toggles the toolbar off or on. Use these buttons to make changes to the contents of the display.

The actions assigned to the icons are, from left to right:
- Pin/Unpin ContextBar (F2) – View or hide the ContexBar by pressing the Pin/Unpin icon. Use the F2 key to toggle the toolbar off or on.
- Link views in split pane defines where to place the linked view, either at the bottom of the current display, or in a separate window itself. (Indented is the default for opening the window in the same frame)
- Toggle Vertical/horizontal Split Pane – View the Split Pane window vertically or horizontally.
- Print View(s)/Options- Print Preview, Print or Print all tabs.
- Graph – Create a graph with the following values: IV Curve, Theo Value, Open Interest, Delta, Gamma, Theta and Vega.
Options Graphing
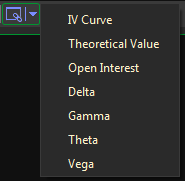
To create a graph of the options series, click on the drop-down arrow next to the chain link button on the context tool bar and select your graph preference.
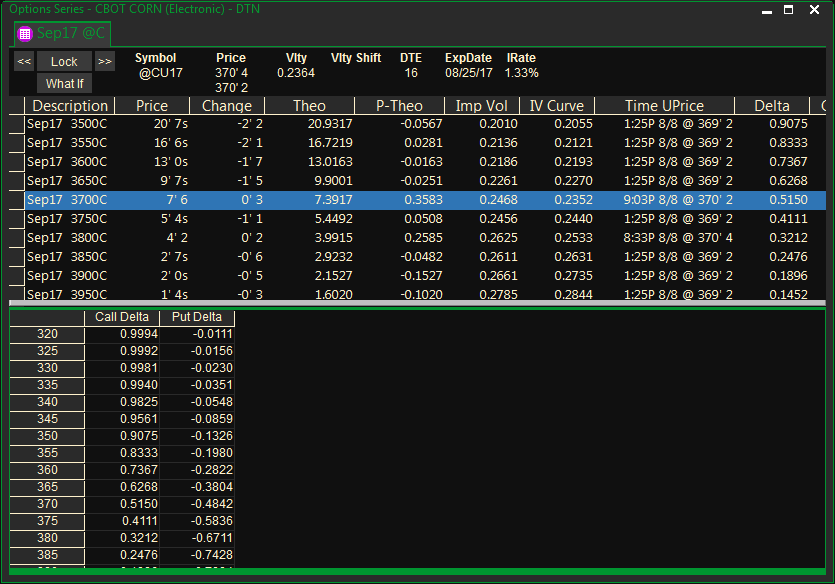
Example of charting the Delta for September 2017 electronic corn:
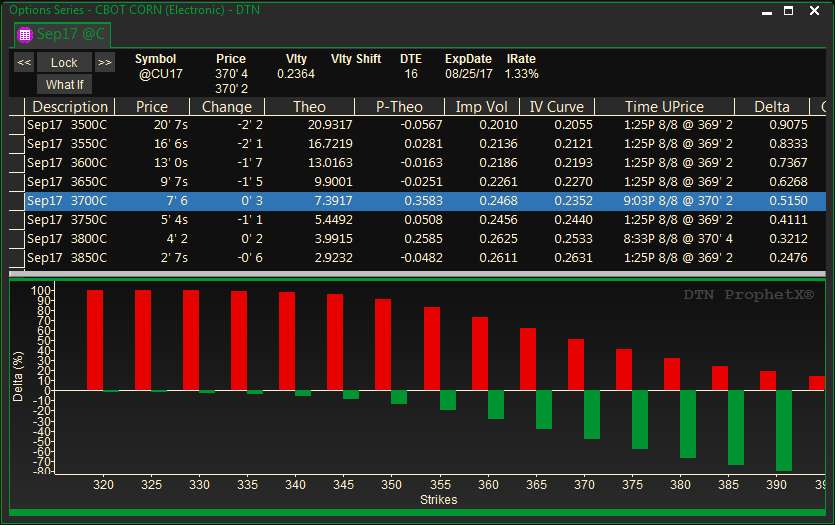
Once a graph is created, you can use the toggle button to show the actual numbers that indicate the graph properties. Click the toggle button again to go back to the graph.
Cox-Ross-Rubinstein Pricing Model – This is a binomial options pricing model that can be added to the Series View.