The Crop Conditions charting module displays both a text and graphic version of previous, current, and normal crop conditions for a select number of growing areas within the United States.
To display Crop Conditions:
- Select Charts > Crop Condition from the Main Menu Bar
- Make sure the context tool bar is showing at the bottom of the display (Press the F2 key to toggle it off or on)
- Select the product you would like to display by clicking on the corresponding crop button on the context tool bar at the bottom of the display. You can choose from the following:
- Corn
- Soybeans
- Spring Wheat
- Winter Wheat
- All Cotton
- Pasture Land
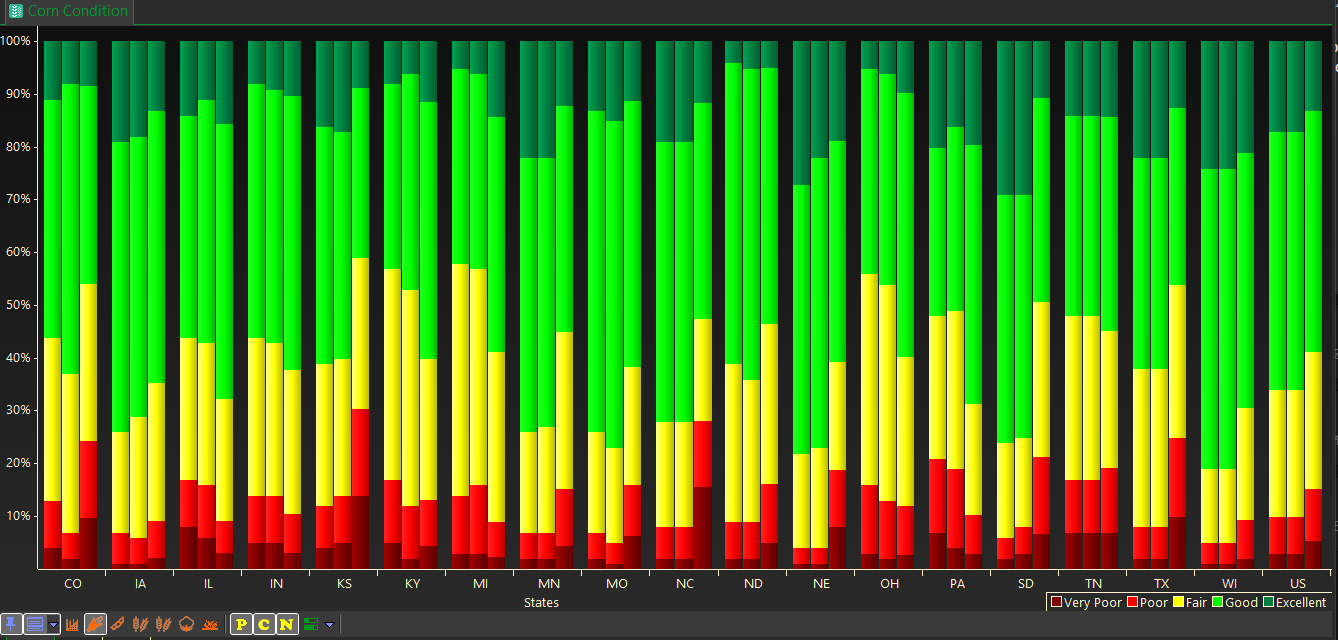
The crop conditions will populate in the display.
- Click on the Graph button
 on the tool bar to toggle between the text or graphic version of the display,
 - You can also right mouse click and Select Grid/Graph view to toggle between the two.

- The next 3 buttons represent the conditions to display – Previous, Current, and Normal, and toggle off or on.
- As you click on the buttons they will indent, indicating which conditions you have selected.
- You have the option to display one or all conditions at the same time. The Graph above has all 3 toggled on.
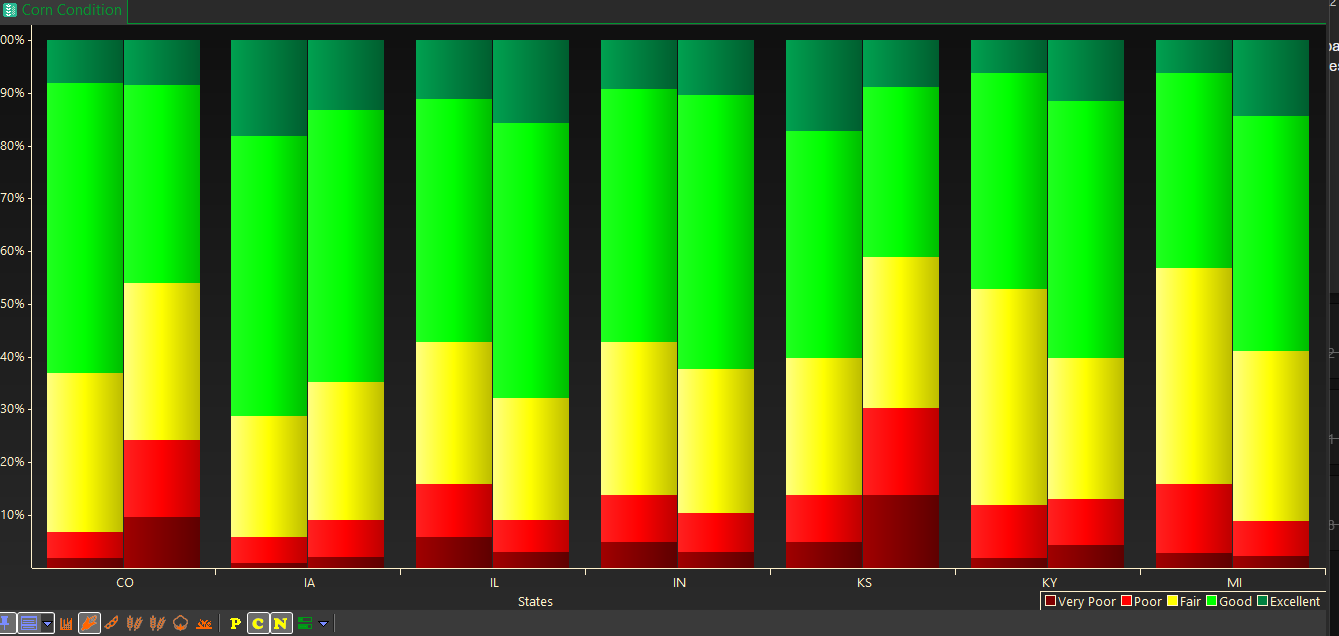
- Below is an example of the hast with only the current and normal corn crop conditions.
- Notice that only two buttons are indented.
Progress
- To show the progress of each crop, select the Progress Icon on the Context Bar.
- The selections will vary depending on what crop you have selected.
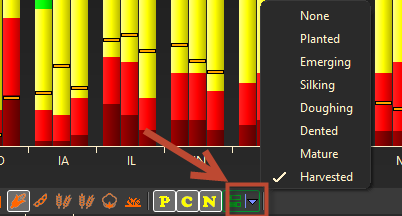
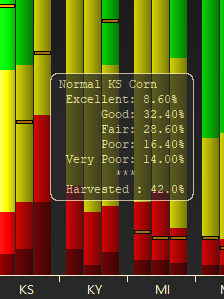
- You will notice the bars on the chart indicating what percentage of the selected is complete.
- By mousing over a bar, you will see additional information
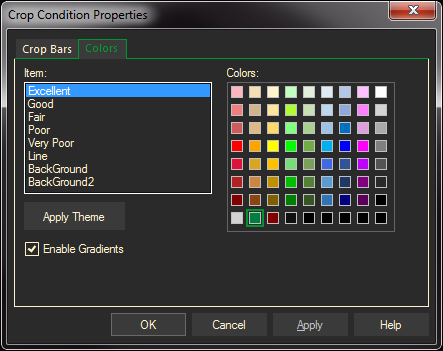
Crop Condition Properties
- Right click in the Crop Condition page and select Graph Properties
- Click on the Crop Bars tab to select the states you want to view in your display and the Add/Remove to adjust those States.
- The default is all of the states reporting the crop data.
- You can also set the Crop Conditions and the Bars you want to view.
- When you are done, click OK or Apply.
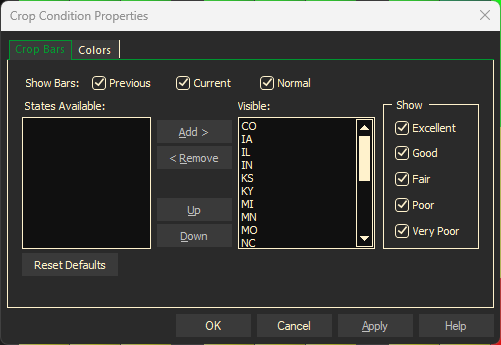
Select the Colors tab to change the colors for the various conditions.