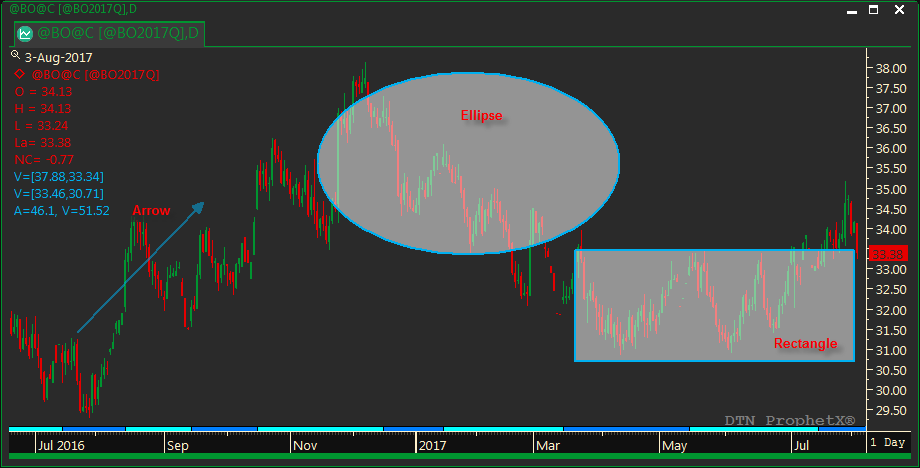
Add Rectangles, Ellipses, and Arrows to a chart. To add a Rectangle, Ellipse, and Arrow to a chart window, first display the Context toolbar.
The Context Tool Bar is located at the bottom of the window frame. The F2 key toggles the toolbar off or on. Use these buttons to make changes to the contents of the display.
Tip: By default the Context Tool Bar is toggled off.
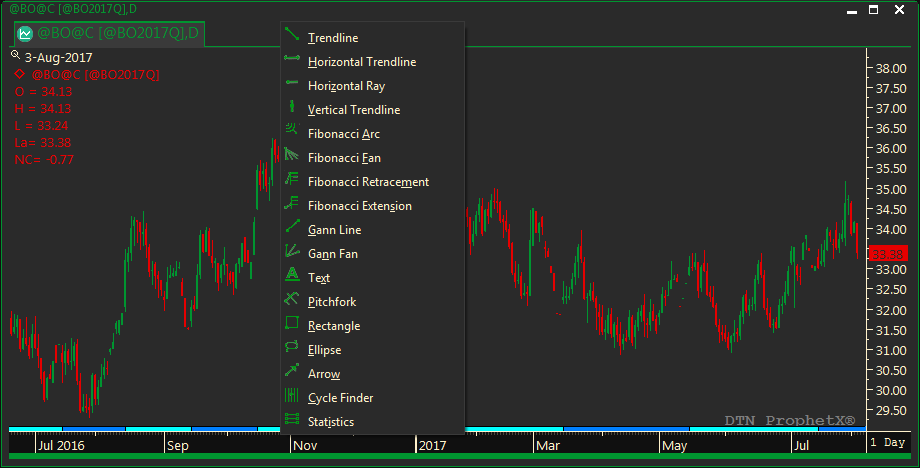
The most recently used Line Study icon appears on the Context toolbar. To access the full Line Study toolbar, click on the arrow to the right of this icon, as shown below.
- On the Context toolbar, click on the Rectangle, Ellipse, or Arrow icon, and then follow the instructions below.

- Click on the Rectangle, Ellipse, or Arrow icon near the bottom of the Line Study toolbar.
- Click on any point inside a chart for your starting point, move your mouse to the desired drawing tool size, then click on any point for your finishing point.

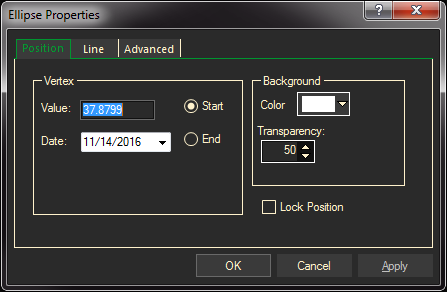
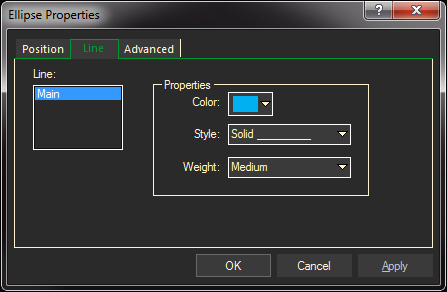
- Right click in the tool to go to Properties to fine tune settings and to change the transparency and color on the drawing element.


The Advanced tab allows you select what to attach the trend line to – the current symbol/expression or to the chart X/Y values.
