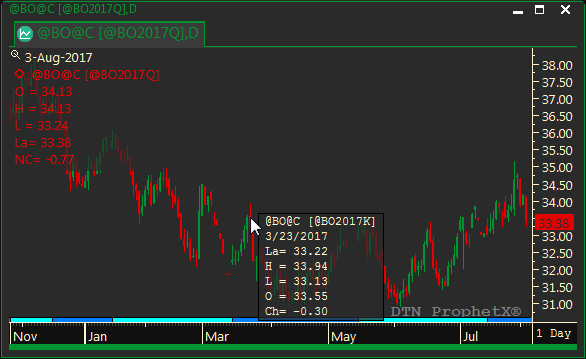
The Tool Tip Window pops up when you hover over a price in the chart.

Unlike the Data Window that displays only the current price in the upper left corner of the chart, the tool tip pops up with the price for any data point you hover over.
You determine whether or not you want to display it. In addition, you can customize it to your own preferences.
To Modify the Tool Tip:
Right-click on a bar or line in the chart and select Tool Tip Properties.

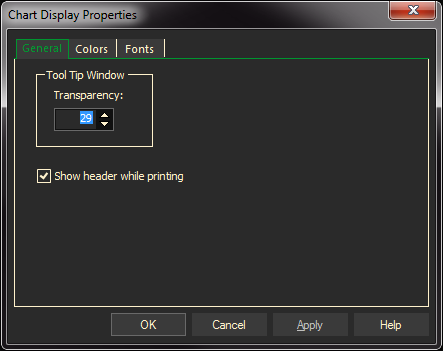
The General tab edits the tool tip’s transparency. It can be set to show the data through the tool tip as shown in the example above, or make the tool tip solid by adjusting the transparency number.
- The Show header while printing will show or hide the symbol header in the tool tip when printing the chart.
- To view changes without exiting the dialog, click the Apply button. To exit and apply changes, click OK.
To Change the Colors
The Colors tab will change the text or the background color of the tool tip

To Change the Font
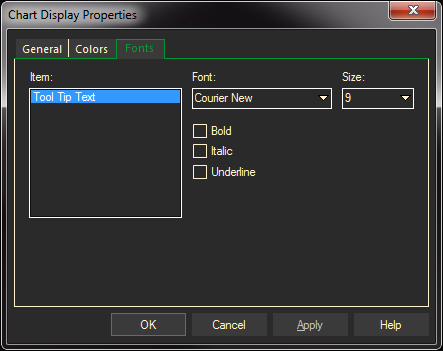
In the Fonts tab, select a font, size, and special effects.

To view changes without exiting the dialog, select Apply.
To save changes select OK.