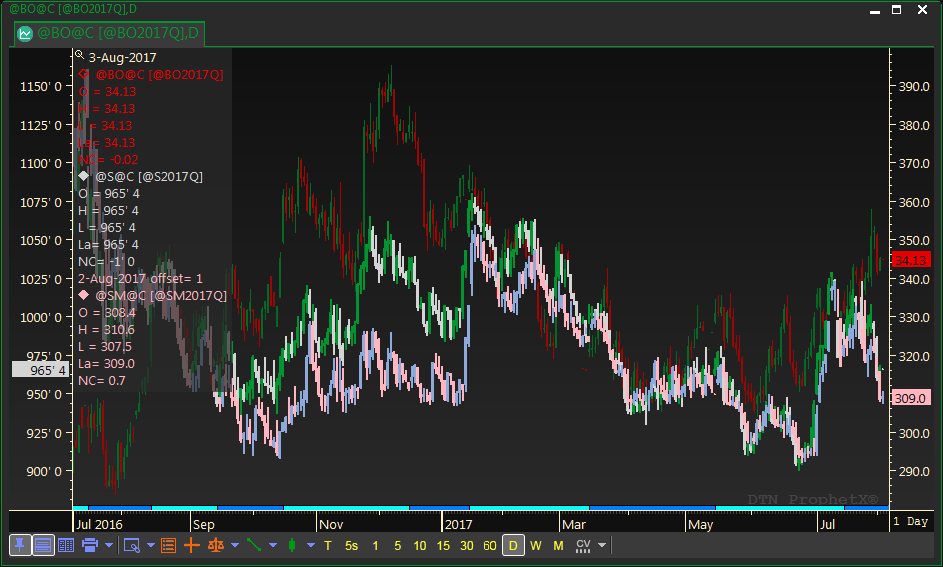
Symbols on the chart can easily be selected so that various functions can be applied to all the activated instruments at the same time.
- Click on the “diamond” activation icon next to the chart symbol in the Quote Window.
- When the “diamond” is activated, right mouse click to adjust the properties for that instrument.
- Only one “diamond” can be activated at a time for this functionality to work.
- Click again to de-activate it.
- An alternate way of activating charts lines is to either right-or left-click on a bar in the chart.
To activate another line, hold down the control key and click on the next line.
Tip: If you don’t press the Ctrl key while clicking, only the line you’re currently clicking will become activated. All others will be deactivated. Therefore, you might be better off using the diamond shapes in the data window to activate and de-activate the chart lines.

For an example of this see Comparison Charting.
Tip: You need to be very careful when charts are activated. Manual scrolling, either in the chart or using the scroll bar below the x-axis will cause the chart bars to move off of their corresponding dates. This is one case where pressing enter will NOT bring the chart back to its original place.