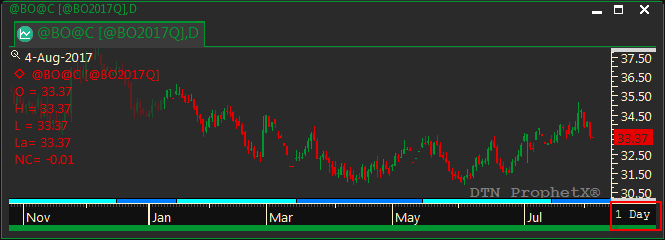
The Chart Time Interval is located in the lower right corner of the chart.

Changing the Time Interval:
There are several ways to change the chart interval:
From the Context Toolbar:
- Select one of the time intervals from the context tool bar at the bottom of the chart window.

Entering the time frame in the chart:
- Type a comma. The symbol or expression entry will display in the lower left corner of the chart just like when you create a chart.
- Then type the increment you want. For example, if you want a 45 minute chart, type, 45. If you want a weekly chart, just type, W.
The chart will change to that interval. To change it back follow the same instructions as above.
From the chart properties:
- Right-Click on the Chart, select Change Interval from the pop-up menu.
- Select one of the time units (Tick, Minute, Daily, Weekly, Monthly) listed.
- In the Day/Bar box, you can change the number of days, weeks (or whatever interval you selected in the above step) to be represented by each bar in the chart. Enter a number, or click the arrows connected to the box to increase or decrease the value.
- Click the OK button.