Shows whether a trade happened towards a Bid (down) or Ask (up).
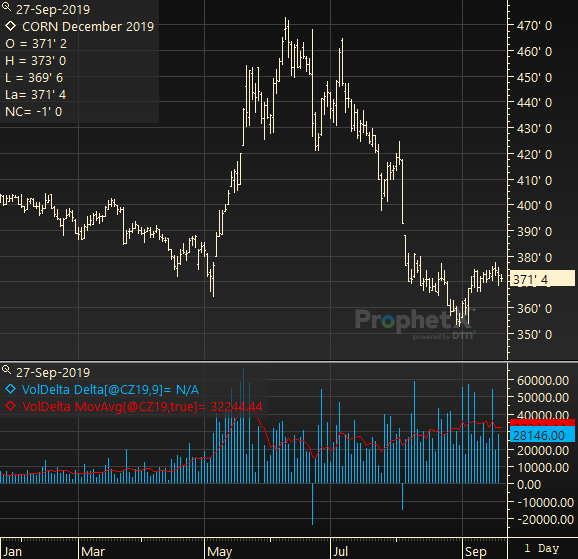
Example of chart with a Volume Delta study
Adding a Histogram in standard Up and Down colors
- Right click on the Volume Delta Study
- Click on the Volume Delta Properties…
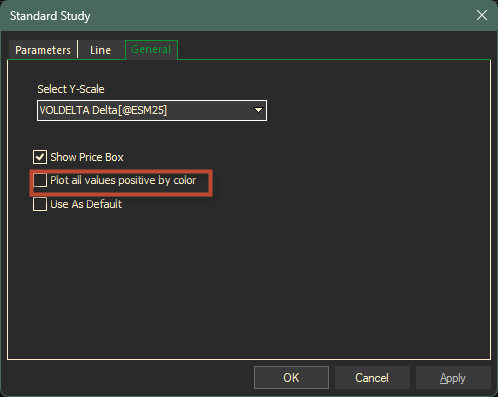
- Select the General Tab
- Click on Plot all values positive by color
- Click Apply or OK