The Seasonal Average can be added to a seasonal chart that uses any instrument that does not have an expiration date, such as a stock symbol, or cash price. Typically the chart would be created by overlaying prices year over year. The Seasonal Average study would average the prices for each day for the number of years on the chart.
TIP: This does not work on a seasonal chart that was created with commodities that have an expiration date. For those you must use the Multi Source Average.
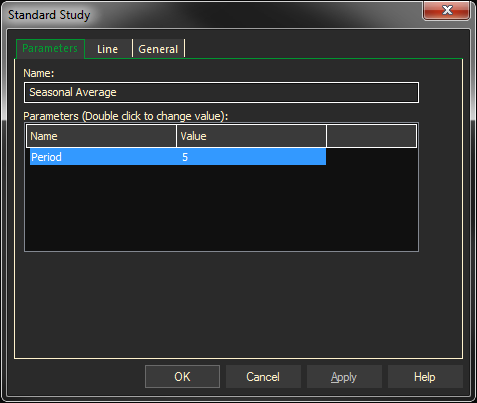
Parameters:
Period indicates the number of most recent years to include in the study.
Adding the Seasonal Average Study to a Chart
- Click on the f(x) Studies docked pane window.
- Click on the plus sign to expand the fx Standard.
- Find the Seasonal Average study, drag and drop it on the chart
Or
- Right-Click on a blank part of the chart and select ADD STUDY.
- Under Data Source, you will find a list of charts and studies in the window. Select the one on which you want the new study to be based.
- Under Studies, select the study you want to add to the window. The library of studies will include standard ProphetX studies plus those that you have created. The Most Recent will include studies that you have previously used.
- Under Add To, select the stack you want to add the study to, or select <New Stack> to create a new stack for the study.
- Click OK to exit.
Changing Parameters
Do either of the following to change the parameters:
- For an existing study on a chart, right-click on the study and select PROPERTIES on the pop-up menu, and modify as necessary.
- Right-click on the study name listed in the f(x) docked pane and make the changes in the displayed dialog. Update will save the parameters permanently.