A psychological line is based on the number of time intervals the market was up during the preceding period. This information is displayed as a percentage.
For example: You have a daily chart on which a psychological line with a period of 12 will be overlaid. On the psychological line, the data point for each day will represent the percentage of days the market was up during the preceding 12 days. If the market was up for 9 of the 12 days and down for 3, it would be represented on the psychological line by a data point at 75%.
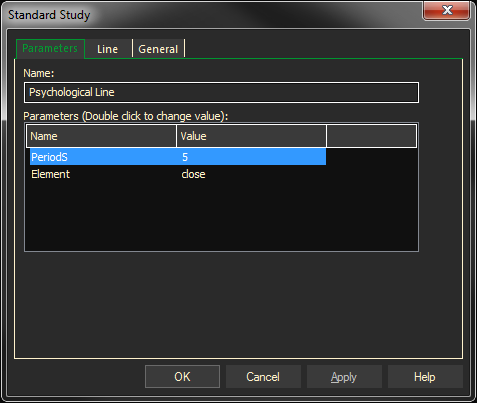
Parameters:
Symbol — data source symbol.
Period — time interval to examine for each value
Element — High, Low, Open, Close
Adding the Psychological Line Study to a Chart
- Click on the f(x) Studies docked pane window.
- Click on the plus sign to expand the fx Standard.
- Find the Psychological Line study, drag and drop it on the chart
Or
- Right-Click on a blank part of the chart and select ADD STUDY.
- Under Data Source, you will find a list of charts and studies in the window. Select the one on which you want the new study to be based.
- Under Studies, select the study you want to add to the window. The library of studies will include standard ProphetX studies plus those that you have created. The Most Recent will include studies that you have previously used.
- Under Add To, select the stack you want to add the study to, or select to create a new stack for the study.
- Click OK to exit.
Changing Parameters
Do either of the following to change the parameters:
- For an existing study on a chart, right-click on the study and select PROPERTIES on the pop-up menu, and modify as necessary.
- Right-click on the study name listed in the f(x) docked pane and make the changes in the displayed dialog. Update will save the parameters permanently.