The Parabolic System also known as the Stop and Reverse (SAR) system. It is a trend following method-using time and price and is constantly in the market. As soon as the trade is initiated it allows time for the market to respond to the change in trend and then as the trend gets underway the stop evolves with the market, gradually and then expediting as the market trend does. Identically it happens in a downtrend, but in the opposite direction. The Parbolic Sar will show one period into the future.
Parabolic Time/Price System Rules:
If Long:
-
Never move tomorrows SAR above yesterdays or today’s low. If the calculated SAR is higher than either of these lows then use the lower low of these two days as the SAR and use this value for SAR calculation for the next day.
If Short:
-
Never move the SAR below the high of yesterday or today. If the calculated SAR is lower than either of these values then use the higher high of these as the SAR for the day and for the future calculation for the following day’s SAR.
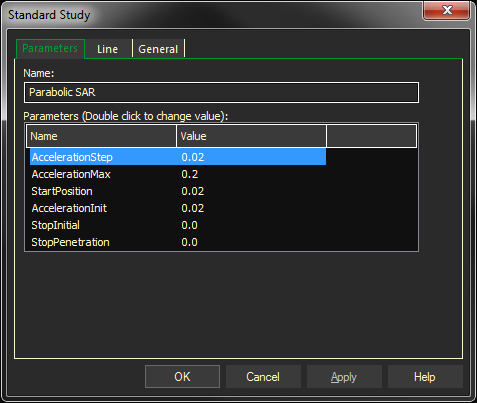
Parameters:
Symbol — data source symbol.
Step: The accelerating size of the Parabola.
Max: The maximum size of the accelerating Parabola.
Adding the Parabolic SAR Study to a Chart
- Click on the f(x) Studies docked pane window.
- Click on the plus sign to expand the fx Standard.
- Find the Parabolic SAR study, drag and drop it on the chart
Or
- Right-Click on a blank part of the chart and select ADD STUDY.
- Under Data Source, you will find a list of charts and studies in the window. Select the one on which you want the new study to be based.
- Under Studies, select the study you want to add to the window. The library of studies will include standard ProphetX studies plus those that you have created. The Most Recent will include studies that you have previously used.
- Under Add To, select the stack you want to add the study to, or select <New Stack> to create a new stack for the study.
- Click OK to exit.
Changing Parameters
Do either of the following to change the parameters:
- For an existing study on a chart, right-click on the study and select PROPERTIES on the pop-up menu, and modify as necessary.