The Moving Correlation function calculates the statistical correlation between two arrays of data over a moving window defined by (Period) positions.
ProphetX uses the Pearson product moment coefficient to calculate correlation. Pearson’s coefficient is defined as the covariance of two variables divided by their standard deviation and results in values ranging anywhere between -1 to +1. A value of +1 implies a perfect linear relationship for which Y increases as X increases. A value of −1 implies a linear relationship where Y decreases as X increases. A value of 0 implies that there is no linear correlation between the variables. If the Period is given as n in the following equation, then the Pearson coefficient at a given position is:
- For each result position (p), ProphetX calculates the correlation of [x, y] values pairs over the domain of [p through p-n-1] positions.
Format
MCORL( 1stSymbol,2ndSymbol,Periods)
Parameters
1st Symbol – first instrument to use
2nd Symbol – second instrument to use
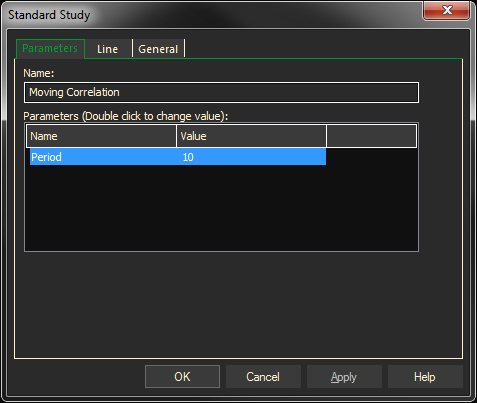
Periods (default: 10 positions) Sample size window over which to calculate correlation for a given position.
Ex: The chart below shows the current crude contract and the WTI Cushing 1 Mo prices with the Moving Correlation study added in light blue.