A departure chart displays the difference between two moving averages, which is plotted as a value above or below zero. Positive values (above the zero line) indicate that the first moving average is higher. Negative values (below the zero line) indicate that the second moving average is higher. (These relationships can be seen by overlaying a departure study on the two moving averages on which it is based.)
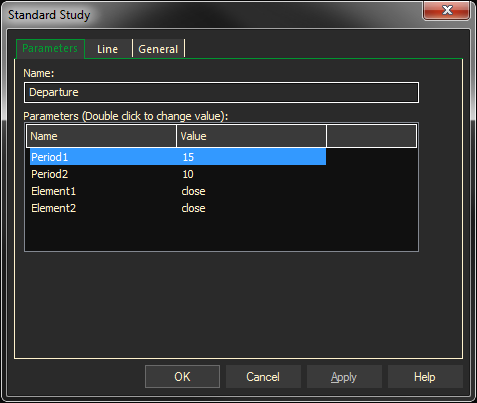
Parameters:
Period1 — first moving average period.
Period2 — second moving average period.
Element1 — price field to use for first moving average (Close, High, Low, Open) = (0,1,2,3).
Element2 — price field to use for second moving average (Close, High, Low, Open) = (0,1,2,3).
Adding the Departure Study to a Chart
- Click on the f(x) Studies docked pane window.
- Click on the plus sign to expand the fx Standard.
- Find the Departure study, drag and drop it on the chart
Or
- Right-Click on a blank part of the chart and select ADD STUDY.
- The Add Study dialog box will open.
- Under Data Source, you will find a list of charts and studies in the window. Select the one on which you want the new study to be based.
- Under Studies, select the study you want to add to the window. The library of studies will include standard ProphetX studies plus those that you have created. The Most Recent will include studies that you have previously used.
- Under Add To, select the stack you want to add the study to, or select <New Stack> to create a new stack for the study.
- Click OK to exit.
Changing Parameters
- Do either of the following to change the parameters:
- For an existing study on a chart, right-click on the study and select PROPERTIES on the pop-up menu, and modify as necessary.
- Right-click on the study name listed in the f(x) docked pane and make the changes in the displayed dialog. Update will save the parameters permanently.