The Calendar Average study will calculate the number of data points (close, high, low, open, volume, open interest) in the monthly or weekly chart and average the weekly or monthly data points.
The weekly calendar average is the average of the data points for one “calendar” week. In other words, sum all the close prices for every Sunday, Monday,…..Saturday and divide by the number of days with close prices.
The monthly calendar average is the average of the data points for one “calendar” month. For example, the calendar average for November is calculated by summing all the close prices for the month of November (NOT the CONTRACT month but the calendar month) and dividing by the number of prices summed.
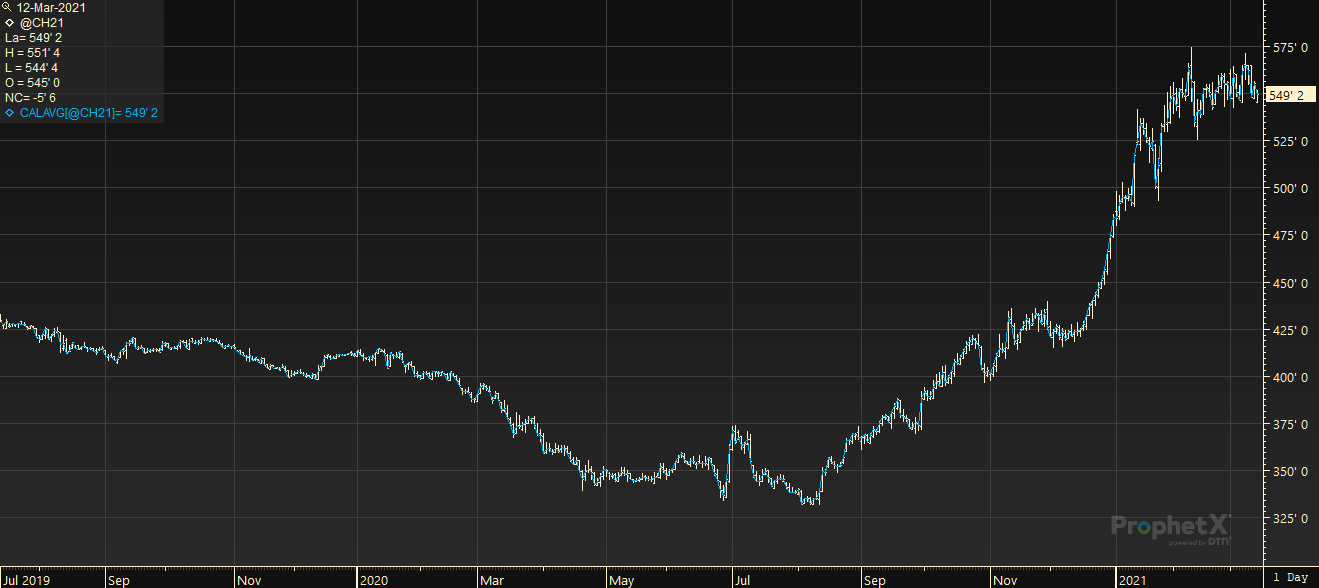
Example of a chart with a Calendar Average study
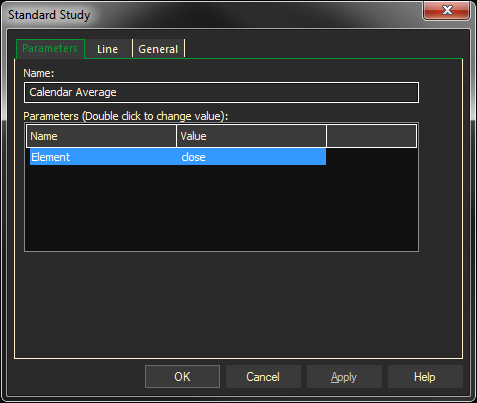
Parameters:
Symbol — data source symbol.
Element — price field to use for calculation (Close, High, Low, Open) => (0,1,2,3)
Adding the Calendar Average Study to a Chart
- Click on the f(x) Studies docked pane window.
- Click on the plus sign to expand the fx Standard.
- Find the Calendar Average study, drag and drop it on the chart
Or
- Right-Click on a blank part of the chart and select ADD STUDY.
- The Add Study dialog box will open.
- Under Data Source, you will find a list of charts and studies in the window. Select the one on which you want the new study to be based.
- Under Studies, select the study you want to add to the window. The library of studies will include standard ProphetX studies plus those that you have created. The Most Recent will include studies that you have previously used.
- Under Add To, select the stack you want to add the study to, or select <New Stack> to create a new stack for the study.
- Click OK to exit.
Changing Parameters
- Do either of the following to change the parameters
- For an existing study on a chart, right-click on the study and select PROPERTIES on the pop-up menu, and modify as necessary
- Right-click on the study name listed in the f(x) docked pane and make the changes in the displayed dialog. Update will save the parameters permanently.
Calendar Average and DTN FastRacks
To get weekly or monthly averages, you have to use the Calendar Average study. The Calendar Average study will calculate the number of data points (close, high, low, open, volume, open interest) in the monthly or weekly chart and average the weekly or monthly data points. In order to display you click on the “close” column. Right-click and in the window click on “Add Study”. Select “Calendar Average” and click “OK”. The new column will be added to the tabular view. The weekly calendar average is the average of the data points for one “calendar” week. In other words, sum all the close prices for every Sunday, Monday,…..Saturday and divide by the number of days with close prices. The monthly calendar average is the average of the data points for one “calendar” month. For example, the calendar average for November is calculated by summing all the close prices for the month of November (NOT the CONTRACT month but the calendar month) and dividing by the number of prices summed.
When looking at a symbol in the tabular view, using the “D” for Daily button you get all the history there is for that symbol.
The view shows the date with an open, high, low and a close. Prices should be showing for every day of the week except Sunday.
Exceptions between FastRacks and ProphetX:
- On holidays that the markets are closed, rack prices do not display.
- A week is Sunday to Saturday and is dated with Sunday’s price, the first day of the week on ProphetX.
- FastRacks defines a week as Monday to Sunday and is dated with Sunday’s price, the last day of the week. FastRacks can also select what days to include in a weekly average. Normally we select Monday to Saturday but it still gets Sunday’s date. So for example, if you compare data from the FastRacks database to ProphetX for weekly averages, they can match but ProphetX will have the date of 1/21/07 for prices from 1/21 to 1/27, and FastRacks will have a date of 1/28/07 for prices from 1/22 to 1/28.