Average True Range (ATR) is a moving average of true range calculated over a number of days. The typical averaging interval is 14 days.
The calculation for True Range is the greatest of the following three values:
- difference between the current maximum and minimum (high and low);
- difference between the previous closing price and the current maximum;
- difference between the previous closing price and the current minimum.
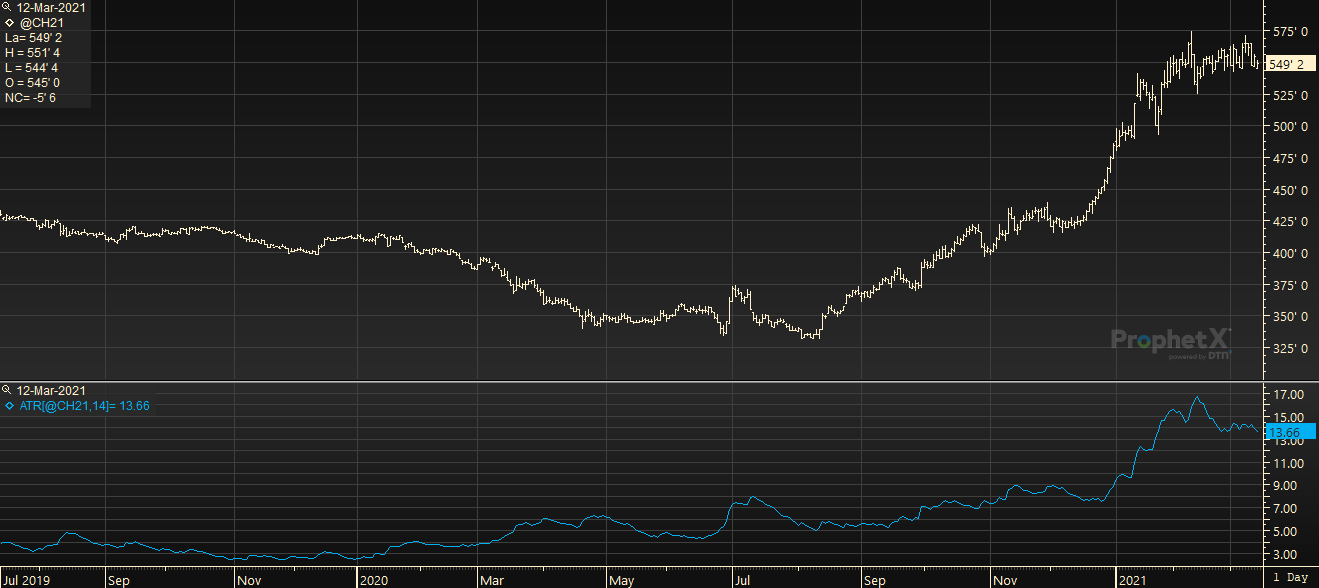
Example of Chart with an Average True Range study.
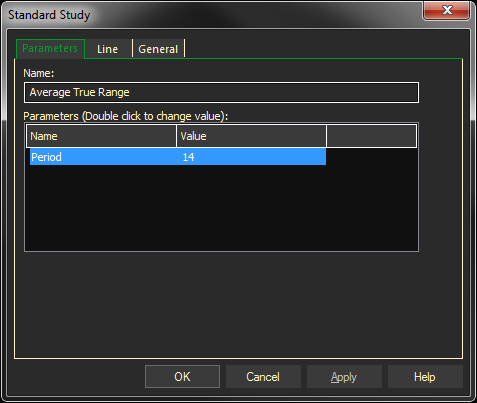
Parameters:
Symbol — data source symbol.
Period — time interval
Example with defaults: ATR (QCL@1, 14)
Adding the Average True Range Study to a Chart
- Click on the f(x) Studies docked pane window.
- Click on the plus sign to expand the fx Standard.
- Find the Average True Range study, drag and drop it on the chart
Right-Click on a blank part of the chart and select ADD STUDY.
- The Add Study dialog box will open.
- Under Data Source, you will find a list of charts and studies in the window. Select the one on which you want the new study to be based.
- Under Studies, select the study you want to add to the window. The library of studies will include standard ProphetX studies plus those that you have created. The Most Recent will include studies that you have previously used.
- Under Add To, select the stack you want to add the study to, or select <New Stack> to create a new stack for the study.
- Click OK to exit.
Changing Parameters
- Do either of the following to change the parameters:
- For an existing study on a chart, right-click on the study and select PROPERTIES on the pop-up menu, and modify as necessary.
- Right-click on the study name listed in the f(x) docked pane and make the changes in the displayed dialog. Update will save the parameters permanently.