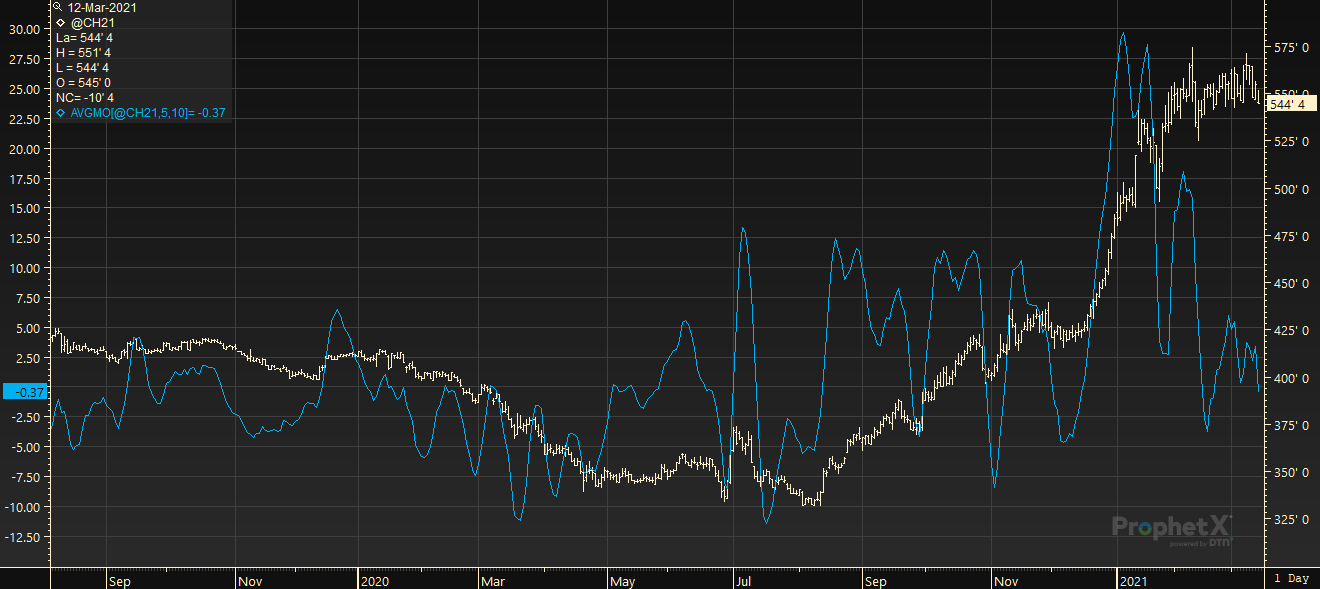
The average momentum (or moving average momentum) study is a momentum calculation in which moving average values are used instead of prices. This yields a somewhat smoothed version of a momentum chart.
Example of a Chart with the Average Momentum Study
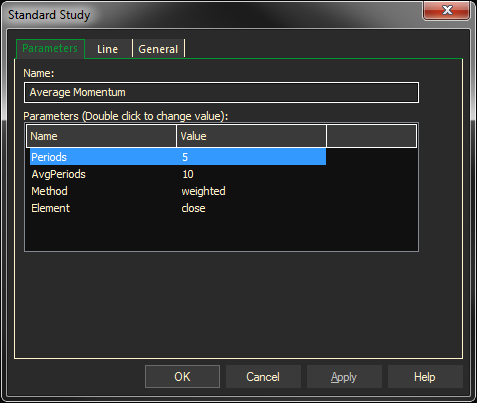
Parameters:
Symbol — data source symbol.
Periods — time intervals to separate the current moving average and the past one to which it will be compared.
Averaging Period — periods for the moving average on which the average momentum study will be based.
Method — moving average calculation method : (Standard, Exponential, Weighted, Running) = (0,1, 2, 3).
Element — price field to use for calculation (Close, High, Low, Open) = (0,1,2,3).
Adding the Average Momentum Study to a Chart
- Click on the f(x) Studies docked pane window.
- Click on the plus sign to expand the fx Standard.
- Find the Average Momentum study, drag and drop it on the chart
Or
- Right-Click on a blank part of the chart and select Add study . The Add Study dialog box will open.
- Under Studies, select the study you want to add to the window. The library of studies will include standard ProphetX studies plus those that you have created.
- The Most Recent will include studies that you have previously used.Under Add To, select the stack you want to add the study to, or select <New Stack> to create a new stack for the study.
- Click OK to exit.
Changing Parameters
- For an existing study on a chart, right-click on the study and select PROPERTIES
- on the pop-up menu, Do either of the following to change the parameters:
- and modify as necessary.
- Right-click on the study name listed in the f(x) docked pane and make the changes in the displayed dialog. Update will save the parameters permanently.